The program will automatically find the required series
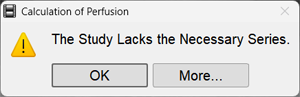
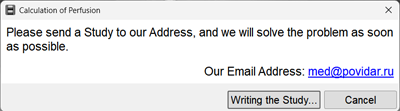
If the T2 Brain Perfusion program does not launch - see below
Settings When Entering the Program
Select a different series
Determine the mask threshold to remove artifacts around the image
Specify which series will serve as the bottom layer, and set its transparency with the slider
Indicate the calculation start - start of the series, stable signal, or bolus
Disable the "smoothing" parameters only if the image in the "T2 Perfusion" program appears blurry
Specify the graph construction parameters
Appearance of the Perfusion Program
The Perfusion program header contains screen layout toggles
Possible options:
Main Mode
Button -
The screen will be split into four panels Top:
Left - original volumes with a measurement reflection line
Right - color perfusion maps Bottom:
Left - subtraction mode
Right - graphs and table
Maps
Button -
The screen will be split into four panels
Each will display one of the main maps (perfusion maps)
In the appeared list, click on the name of another map
Maps already on screen are not available in the selection list
Maps and Tables
Button -
The screen will be split into three panels Top:
Color perfusion maps, with the ability to switch maps Bottom:
Graphs and table
Correcting Reference Positions of Artery and Vein Cursors (if necessary)
Scroll through the multi-volume in main mode (Button - - in the series header),
(See Scrolling Through Multi-Volumes) until a volume with filled vessels appears
Click the button .
Correct the artery position:
hover the mouse cursor over the vessel cursor
press and hold the left mouse button
move the mouse to drag the vessel cursor
release the left mouse button
If the vessel is identified incorrectly by the program, scroll through the images to the best vessel display and click on the vessel
Click the button
Correct the vein position, mouse actions are similar to those described above
Click again on the button to exit correction mode (the A and V buttons should be black)
The program will automatically recalculate the result
Constructing Regions of Interest
Constructing Regions of Interest for Vascular Pathologies
The indicator button for the reflection line should be active; if not, left-click it
Correct the measurement reflection line
Necessary for measurement accuracy
On any image, align the measurement reflection line with the interhemispheric fissure
Click the "Reflected Oval" button next to the Reflection Line button
Construct an Oval on the image; it will automatically be reflected in the contralateral hemisphere
Data for both areas will appear
Constructing Regions of Interest for Oncological Processes
 in the Toolbar
 "Brain Perfusion T2"


 .
.
 for the reflection line should be active; if not, left-click it
 next to the Reflection Line button
 , then click the "Reflect Measurement" item
 to copy the analysis results to the clipboard for pasting into a standard text document
 to save the analysis results to a *.csv file for subsequent analysis in MS Excel
 to send the analysis results for printing