In the list that appears, click on the name of another map
Maps already displayed on the screen are not active in the selection list
Selecting a Different Scale
Click on the color scale
In the list that appears, click on the name of another scale representation
Maps and Tables
Button -
The screen will be split into three panels
Top:
Left - averaged Temporal MIP map
Right - color maps, with the ability to switch via the active overlay
Bottom:
Graphs and table
Penumbra
Button -
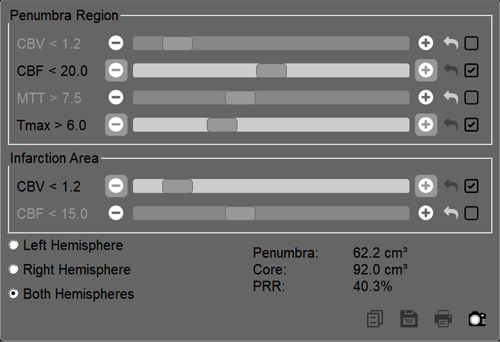
The screen will be split into six panels: an averaged Temporal MIP map, four main maps, and a control panel:
The most frequently used parameters and their values are set by default
To include an additional parameter in the calculation, click the checkbox (check the box) next to the parameter
To change a parameter value, use the sliders or the plus/minus buttons at their ends
To quickly return to the default value, click the button next to the parameter
Use the radio button to select the hemisphere (or - both)
Buttons for saving calculation results are described below
Motion Artifact Correction
If the patient moved their head during the examination, motion correction is performed BEFORE correcting the positions of the artery and vein cursors
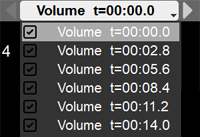
Scroll through the multi-volume in the main mode (Button - - in the series header)
See Scrolling Multi-volumes
In the volume list (in the series header), uncheck the boxes next to volumes with patient head movement
Click anywhere on the screen to exit the volume exclusion mode
The program will automatically recalculate the result
Correction of Reference Artery and Vein Cursor Positions
Scroll through the multi-volume in the main mode (Button - - in the series header), (See Scrolling Multi-volumes) until the volume with filled vessels appears
Click the button in the series header
Correct the artery position:
hover the mouse cursor over the vessel cursor (white dot)
hold down the left mouse button
move the mouse to drag the vessel cursor
release the left mouse button
If the vessel was identified incorrectly by the program, scroll through the images to the best vessel display and click on it with the mouse
Click the button
Correct the vein position
Mouse actions are similar to those described above
Click again on the button to exit the correction mode (the A and V buttons should be black)
The program will automatically recalculate the result
Creating Regions of Interest
Creating Regions of Interest for Vascular Pathologies
Click the Measurement Reflection Line button in the series header
Adjust the measurement reflection line so that it coincides with the interhemispheric fissure by moving it entirely and dragging its ends with the mouse (hold down the left mouse button, drag, release)
Click the "Reflected Oval" button to the right of the Reflection Line button
Draw an Oval on the image, it will automatically be reflected in the contralateral hemisphere
Data for both regions will appear on the graph and in the table
Creating Regions of Interest for Oncological Processes
 in the Tool Panel, then - on the
 "Brain Perfusion" button
 button restores the default Perfusion program settings
 button saves user-defined Perfusion program settings


 button in the series header
 button
 Measurement Reflection Line button in the series header
 to the right of the Reflection Line button
 , then - on the "Reflect Measurement" item
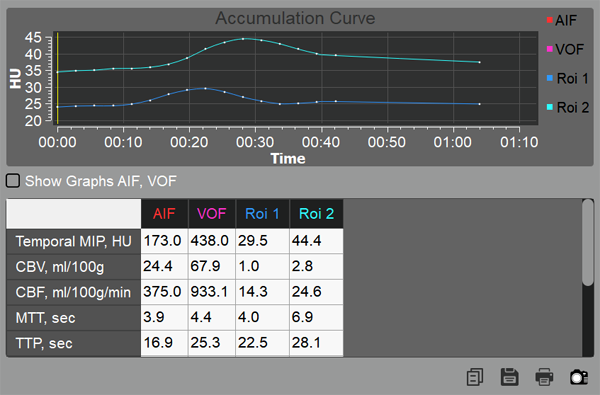
 to copy the analysis results to the clipboard for pasting into a standard text document
 to send the analysis results to print
 to save the on-screen image to a custom series (it will be located at the end of the study in the Preview Bar)