Phantomless Densitometry is Used in Vidar Dicom Viewer
The patient's paravertebral muscles and subcutaneous fat are used as calibration standards
The trabecular part of the vertebral body is used for measuring bone density
The program uses a European database of reference patient groups, as it can be applied to both sexes, aged 20 to 80 years
Accuracy errors are approximately 5 - 15% compared to the true mineral content
One of the advantages of the analysis is good reproducibility of the settings of the zones of interest in repeated studies, by placing images of 2 studies side by side
The Program Calculates the Following Parameters: BMD Index (Bone Mineral Density), T- and Z-Scores
T-score - The difference between a specific patient's BMD and the average BMD of a young healthy individual
Z-score - The difference between the patient's BMD and the average BMD of individuals of the same age and sex
This difference is expressed in units of standard deviation (SD)
Z-score and T-score are not comparable with results obtained based on DXA32
Note: The use of multislice computed tomography (MSCT) in children solely for the study of bone mineral density is contraindicated
If assessment in a child is performed parallel to another examination, only Z-scores should be used, i.e., comparison with a control group of the same age
Requirements for Successful Use of the Program
Regular calibration of the MSCT system using a phantom
Correct patient positioning: supine, arms above the head, no metal objects in the scanning area
Correct selection of vertebrae and their body areas (without fractures, pathological formations, etc.)
Correct selection of muscle and adipose tissue areas (without additional inclusions)
Launching the CT Densitometry Program
Left-click the "Programs" button in the Tool Panel.
Left-click the "Densitometry" button
Series Selection
If a topogram is on screen, a series selection window will appear
The native phase of the study is required
To select another series, click the down arrow, then - on the series line
Click the "OK" button
The screen will split into four panels:
Three - standard MPR projections
One - resulting graph, buttons for managing regions of interest and saving analysis results
Specifying the Vertebra Under Study
On the left, under the graph, click the down arrow next to the "Vertebra" item to open the vertebra list
Click on the number of the vertebra selected for analysis
Specifying Sex and Age
Used only if the patient's sex and age are not specified in the study itself (e.g., anonymized study, or operator error)
Find out the patient's sex and age
On the left, under the graph, click the down arrow next to the "Sex" or "Age" item to open the list
Click on the required item from the list
Creating Spheres of Interest
Select a lumbar vertebra without artifacts (see above)
Click the "Bone" button
Click on the spongy part of the vertebra and create a sphere
Adjust its position and size
Repeat similar manipulations with the "Muscle" and "Fat" buttons
Pay attention to the densities of muscle (50-60 HU) and adipose (-90 - -100 HU) tissues; if they fall outside standard ranges, calibrate the device
Correcting Spheres of Interest:
Click on the button with the name of an already placed sphere
It will be removed from the image
Scroll through the scans to the desired level
Click again on the button of the sphere being edited
Click on the anatomical location for the sphere
Completing the Analysis
After specifying the vertebra and placing all spheres, a point corresponding to the vertebral bone mineral density (BMD) will appear on the graph
Colors on the graph:
Green: 1—2 standard deviations above average
Yellow: within ± 1 root mean square standard deviation
Red: 1-2 root mean square standard deviations below average
Text information of the analysis data is at the top of the graph
Saving Analysis Results
Buttons for saving analysis results are located in the lower right corner of the graph's tool panel
Click the "Copy" button to copy the analysis results to the clipboard for pasting into a standard text document
Click the "Save" button to save the analysis graph image to a *.png format file
Click the "Print" button to send the analysis results to print
Click the "Save User Series" button to save the analysis results to a user series (it will be located in the Preview Bar at the end of the study)
Note:
The state of the Densitometry program and all measurements performed are saved in the Study Finds More details
Exiting the Densitometry Program
Click the "Densitometry" button in the top left corner of the program
Click on the "Exit Mode" item
The Densitometry program will be replaced on screen by the series on which it was based
Comparing Indicators Over Time
Display the previous study on screen
Launch the Densitometry program from the Finds
Visually note the positions of the regions of interest and the vertebra number
 in the Tool Panel.
 "Densitometry" button
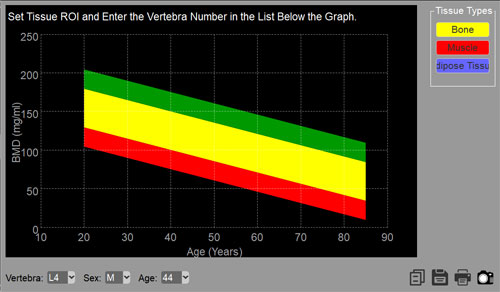
 to copy the analysis results to the clipboard for pasting into a standard text document
 to save the analysis graph image to a *.png format file
 to send the analysis results to print
 to save the analysis results to a user series (it will be located in the Preview Bar at the end of the study)