Note: For percentile calculation, the patient's age and sex must be specified in the DICOM data
Statistics used in this program:
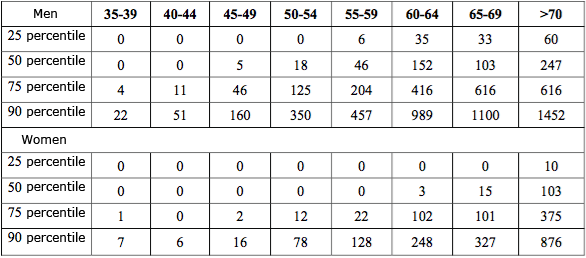
Journal of Cardiovascular Computed Tomography
Volume 14, Issue 5, September–October 2020, pp 414-42
 in the tool panel, "Studies" group
 , which allows displaying three standard MPR panels and a control panel with the results table for complex cases
 in the control panel
 to copy the analysis results to the clipboard for pasting into a standard text document
 to save the analysis results to a *.csv file for subsequent use in MS Excel
 to send the analysis results to the print
 to save the analysis results to a user series (it will be located in the Preview Bar at the end of the study)