The "Aneurysm Analysis" program is designed for analyzing aneurysm parameters
Launching the "Aneurysm Analysis" Program
Build a vessel in the "Vessels" Program, or select a ready-made one from the list
Click on the "Vessel Analysis" button
Click on the "Aneurysm Analysis" button
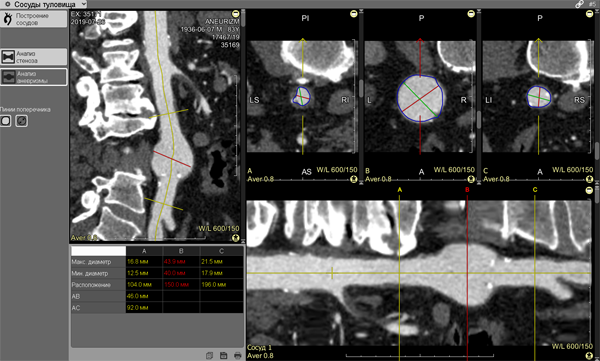
The screen will split into 6 panels:
1 - oblique projection with free rotation
2 - first control cross-section
3 - aneurysm zone cross-sections
4 - second control cross-section
5 - measurement results table
6 - vessel longitudinal view:
Manipulations for Correct Aneurysm Analysis
Use the scroll bar slider on the vessel longitudinal view panel, or rotate the mouse wheel to achieve optimal display of the aneurysm
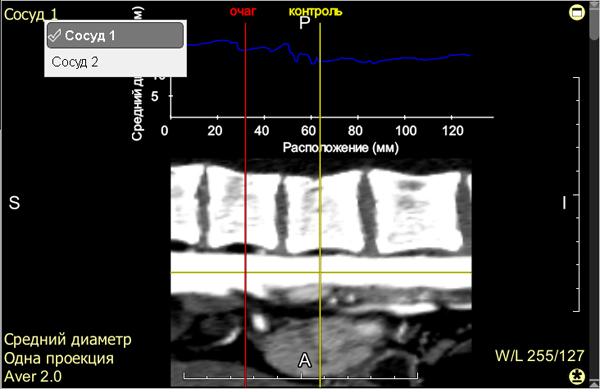
Place the red linear cursor on the longitudinal view in the area of the aneurysm's maximum lumen:
Hover the mouse cursor over the red line
Hold down the left mouse button
Move the mouse left or right
Move the yellow linear "Control" cursor on the longitudinal view to a presumably "normal" vessel lumen:
Hover the mouse cursor over the yellow line
Hold down the left mouse button
Move the mouse left or right
The second "Control" cursor will move synchronously relative to the red cursor
Use the scroll bar sliders on the vessel cross-section panels, or rotate the mouse wheel to scroll through the images
Adjust the lumen contour on the cross-sections to exclude branching vessels and construction artifacts:
Hover the mouse over the contour
Press and hold the left mouse button
Trace strictly along the outer contour of the vessel lumen, excluding construction artifacts
Release the left mouse button
Aneurysm Analysis Results
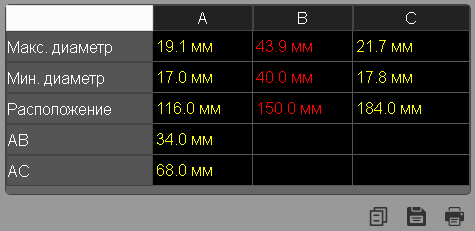
In the table (lower left panel of the screen), measurement results are displayed dynamically:
maximum diameter
minimum diameter
cross-sectional area
position relative to the construction point
distance between the first control cursor and the cursor at the aneurysm's maximum diameter, and between the first and second control cursors
Saving Results
Click the "Copy" button to copy the calculation results to the clipboard for subsequent pasting into a standard text document
Click the "Save" button to save the calculation results to a *.csv format file for subsequent calculation in MS Excel
Click the "Print" button to send the calculation results to the printer
If more than one vessel has been built, you can, without switching to the Vessel Construction mode, select another vessel for aneurysm analysis
Click in the active overlay of the longitudinal view on another vessel from the list:
Selecting the Number of Projections
The number of longitudinal view projections for constant display can be set in the Settings of the Vessels program (see below)
Similar control of reconstructions and projections is available in the Vessel Construction mode
Hide/Show Contour and Diameters on Cross-Sections
In the "Vessels" program panel, in Analysis mode, left-click on:
- hides/shows contours and diameters on cross-sections
- hides/shows only diameters on cross-sections
Useful Tips
During measurements on cross-sections, hide the cursors (press the key on the keyboard) so they don't interfere
After construction - return them to the screen in the same way
When editing a cross-section contour, enlarge the panel by double-clicking on it, or click on the icon in the upper right corner of the panel
After editing - return it to its size in the same way

 - hides/shows contours and diameters on cross-sections
 - hides/shows only diameters on cross-sections
 key on the keyboard) so they don't interfere
 icon in the upper right corner of the panel