
Buttons located in the same groups are highlighted with the same color
 icon to open the density menu
 icon
icon| Button | Function | Mouse | Keyboard |
|---|---|---|---|
| "Figures" Group | |||

|
Circle |
|

|

|
Oval |
|
 |

|
Rectangle |
|
|
| "Curves" Group | |||

|
Curve |
|
|

|
Polyline |
|
|
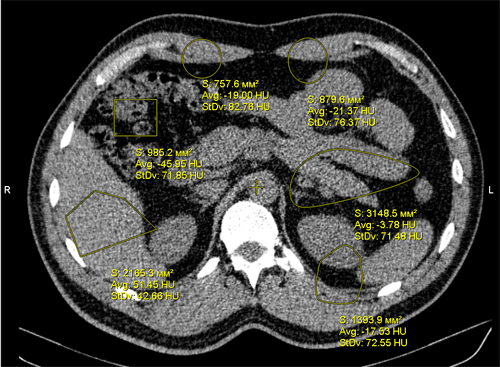
| "Areas" Group | |||

|
Closed Curve |
|
|

|
Closed Polyline |
|
|

|
Closed Pencil, or Freehand Drawing Pen |
|

|

|
"3D Sphere" | See "3D Measurements" | |

|
Volume Construction by Contours |
See "3D Measurements" | |

|
Volume Construction by Density |
See "Volume Construction by Density" | |
| Create Accumulation Curve | See "Accumulation Curve Construction" | ||
near the measurement result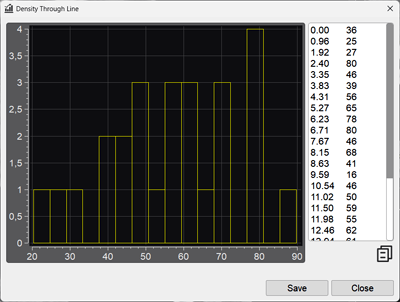

 key on the keyboard
For editing measurements, see Measurement Manipulations