go to Vidar Dicom Viewer page
3D Visualization Mode Settings
The program allows you to fine-tune the visualization mode (preset) for a 3D model and save the preset for later use
All setting changes are immediately reflected on the 3D model
Open 3D Visualization Mode Settings
Switch to the
3D model mode
Click on the current preset in the
active overlay
In the presets menu, select the item
Edit
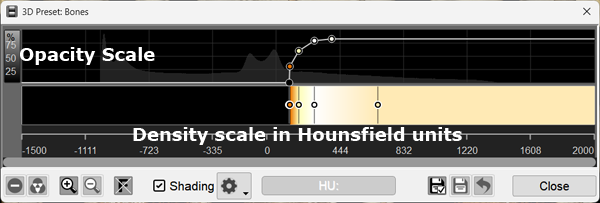
The 3D Visualization Mode Settings window will appear
The curve on the top graph defines transparency
Points at the bottom of the graph are transparent, at the top - opaque
Transparency changes linearly between points
For better visibility, a histogram is displayed in the background
The color palette is defined below
Points define colors
Color between points is calculated as a linear gradient
At the bottom, for CT - the density scale is in Hounsfield units, for other studies - pixel brightness values
This way you can set the transparency level and color (gradient) for a range of density values
Configuring the Mode
To manipulate a point on the graph/palette, left-click on it
Move a Point
Click and hold the mouse button over a point on the graph
Drag the mouse to move the point
Release the mouse button
Add a Point
To add a new point to the opacity graph, left-click on the graph
To add a new point to the palette, left-click on an empty area of the color palette
A color selection window will appear:
Click on the desired color
Click the
OK
button
Delete a Point
Click on the desired point with the
right
mouse button, or
If the point is already selected, click the button at the bottom of the editor window:
Set Color for a Palette Point
Click on the desired point, or
If the point is already selected, click the button at the bottom of the editor window:
A color selection window will appear, just like when creating a new point
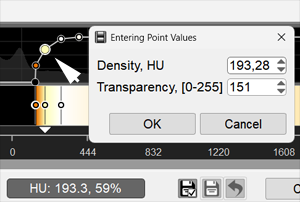
Set Density Value for a Point in Hounsfield Units
Click on the desired point
Click on the density value at the bottom of the editor window (outlined):
A window for selecting point density and opacity will appear - enter the values
Zoom In/Out Graph and Palette
Changing the editor zoom is useful when dots overlap
Click the button
to zoom in, or
click
to zoom out
Image Filters
This function is useful when there is a lot of noise on the 3D model
Click on
, then:
Smoothing
or
Median - for removing spot noise
Shading
Lighting parameters for the preset
Ambient
- overall brightness (illumination of the model as a whole)
Diffuse
- light source brightness (illumination from the model viewing point)
Specular
- highlight brightness (how "shiny" the surface is)
Saving Settings
You can edit existing presets or create new ones
Save Current Preset (Replace It)
Click at the bottom of the editor window:
A confirmation prompt to replace the current preset will appear
Confirm or cancel the action
Click the
OK
button
Create a New Preset
Click at the bottom of the editor window:
A window for entering a name for the new preset will appear
Enter a name for the new preset
Click the
OK
button
The preset will appear in the general list of presets
Restore Preset
You can restore the settings of standard presets that come with the program
Click at the bottom of the editor window:
A confirmation prompt to restore the current preset will appear
Confirm or cancel the action
Delete Preset
Only user-created presets can be deleted
Warning! A deleted preset cannot be restored!
Click at the bottom of the editor window:
A confirmation prompt to delete the current preset will appear
Confirm or cancel the action
See also
3D Model
Measurements Available on 3D Model
3D Marker
Saving 3D Model for 3D Printing
Vidar Dicom Viewer Help 3.0, © 2026
PO Vidar
 Edit
Edit


 to zoom in, or
 to zoom out
 , then:
 Smoothing
 Median - for removing spot noise


